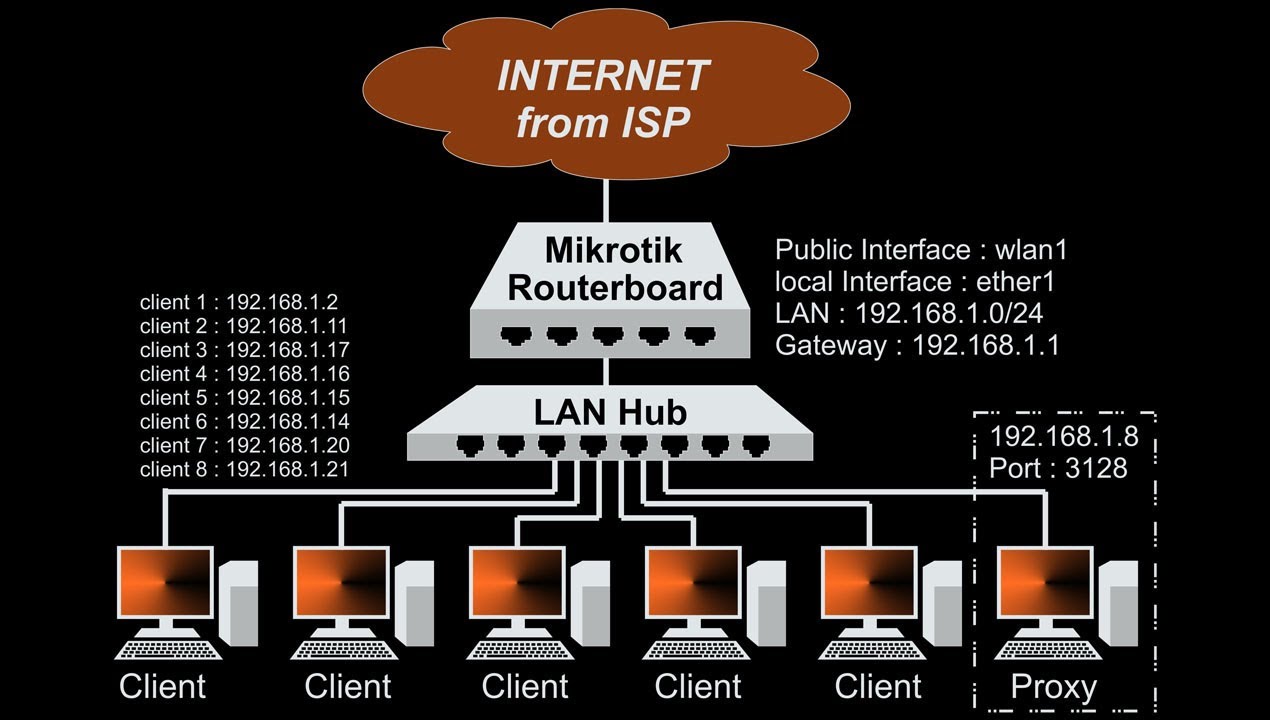
Analyzing Traffic Flow MikroTik RouterOS Monitoring Tools
As technology continues to advance, businesses need to stay competitive by keeping their networks and internet devices up to date. Monitoring your devices using SNMP and tools like ELK stack can ensure that your network remains secure and efficient. Here's how it's done:

What is SNMP?
SNMP, or Simple Network Management Protocol, is a protocol used for managing and monitoring network devices. These devices can include routers, switches, servers, printers, and others. SNMP functions by collecting data from these devices, which can then be used to identify problems or inefficiencies in the network.
SNMP operates by sending messages, called SNMP queries, to network devices. These queries retrieve information from the devices, such as CPU and memory usage, bandwidth usage, and other network statistics. SNMP can also be used to configure and control network devices, such as setting up new network policies or updating device firmware.
What is ELK Stack?
ELK stack is a software suite used for log management and analysis. The ELK stack consists of three open source software tools: Elasticsearch, Logstash, and Kibana. Together, these tools offer a scalable platform for collecting, processing, and visualizing log data.
Elasticsearch is a search and analytics engine that provides a distributed, multitenant-capable full-text search engine. Logstash is a data processing pipeline that ingests data from a multitude of sources simultaneously, transforms it, and then sends it to Elasticsearch. Kibana is an analytics and visualization platform designed specifically for Elasticsearch data.
Why Monitor Your RouterOS?
RouterOS is the operating system used on MikroTik routers and other network devices. Monitoring RouterOS using SNMP and ELK stack can provide you with valuable insights into your network, such as identifying network traffic patterns, monitoring device performance, and detecting unusual activity.
How to Monitor RouterOS With SNMP and ELK Stack
Here are the steps for monitoring RouterOS with SNMP and ELK stack:
- Enable SNMP on RouterOS
- Install and Configure Logstash on a Server
- Install and Configure Elasticsearch on a Server
- Install and Configure Kibana on a Server
- Create Dashboards and Visualizations in Kibana
To enable SNMP on RouterOS, log into your router's WebFig interface. Go to System > SNMP, and make sure that Enable SNMP is checked. Set the SNMP community to something secure, and then click Apply.
Install Logstash on a server using the instructions provided on the Elastic website. Configure Logstash to collect data from RouterOS using the SNMP plugin. Set up the plugin by providing the SNMP community string and a list of OIDs to collect.
Install Elasticsearch on a server using the instructions provided on the Elastic website. Configure Elasticsearch to store the data collected by Logstash.
Install Kibana on a server using the instructions provided on the Elastic website. Configure Kibana to visualize the data stored in Elasticsearch.
Use Kibana to create dashboards and visualizations that provide insights into your network. For example, you could create a dashboard that displays network traffic patterns and alerts you when traffic exceeds a certain threshold. Or you could create a visualization that displays device performance metrics.
Conclusion
Monitoring your network using SNMP and ELK stack can provide you with valuable insights into your network, helping you to identify problems and inefficiencies and keep your network secure. By following the steps outlined above, you can set up a powerful monitoring and analysis platform that will help you ensure the efficiency and security of your network.


Post a Comment for "Analyzing Traffic Flow MikroTik RouterOS Monitoring Tools"